
The Direction of Demand as Indicated by Ticket Prices
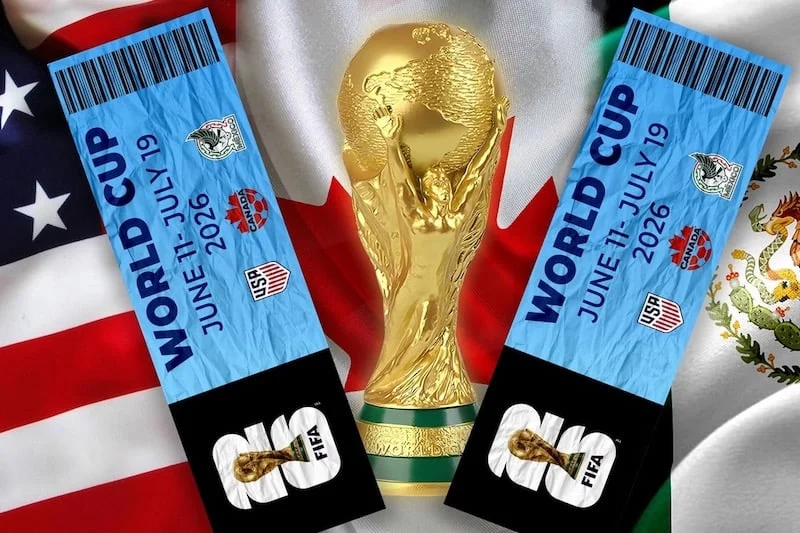
Ticket sales for the 2026 FIFA World Cup have begun, andthe FIFA official resale markethas accumulated sufficient price data.
There is still time before the tournament, and in terms of the overall sales period, we are currently in theearly phase..
In this article, we examineReferencing price information listed on the FIFA official resale platform,we
use ticket prices as an objective indicator to
organize which countries' matches are attracting relatively high demand (popularity)
on a country-by-country basis.
Note that this analysis aims to
understand popularity and demand trends through pricing,popularity and demand trends,
and to observe where the market has settled after the initial post-lottery hype faded.where the market has settled.
It is intended to provide an overview, and
does not make definitive claims about lowest prices or best-value seats.
- Country-by-Country Ticket Price Ranking (FIFA Official Resale Reference)
- Analysis 1: Characteristics of countries with persistently high prices
- Analysis 2: The initial hype that inflated right after the lottery
- Analysis 3: Countries with stable prices = countries with strong genuine demand
- Scope of this article (important)
- Summary
Country-by-Country Ticket Price Ranking (FIFA Official Resale Reference)
Note: Exchange rate is 1 USD = 155 JPY (approximate).
Based on official resale observation data as of December 2025.
Rankings are based on current official resale prices.
Pre-lottery prices are shown for reference.
About this ranking (methodology)
This rankingis not meant to show absolute ticket price levels, but rather serves as an indicator for understanding country-level price trends (i.e., popularity)..
Specifically, for each match:
We checked the lowest listing prices across all categories (Cat 1 through 4) on the official resale.
The highest among those lowest prices is defined as 'the price for that match.'
Then,we averaged those prices across each country's three group stage matchesto create the country-by-country ranking.
This methodology is based on
the price range that is unavoidable to attend that match, regardless of category.
Therefore,if you are willing to accept seats like behind the goal, there are many cases where you can attend for less.
Country ranking (current price + pre-lottery price)
| Rank | Country | Current price (USD) | Current price (JPY) | Pre-lottery avg (USD) | Pre-lottery avg (JPY) | Change rate |
|---|---|---|---|---|---|---|
| 1 | Mexico | $5,556 | Approx. 861,200 yen | $10,550 | Approx. 1,635,000 yen | ▲47.3% |
| 2 | South Africa | $2,940 | Approx. 455,700 yen | $11,800 | NA | Limited pre-lottery data |
| 3 | United States | $2,721 | Approx. 421,800 yen | $3,220 | Approx. 499,000 yen | ▲15.5% |
| 4 | Canada | $2,435 | Approx. 377,400 yen | $2,605 | Approx. 404,000 yen | ▲6.5% |
| 5 | Colombia | $2,050 | Approx. 317,800 yen | $2,590 | Approx. 401,000 yen | ▲20.8% |
| 6 | South Korea | $2,027 | Approx. 314,200 yen | $2,270 | Approx. 352,000 yen | ▲10.7% |
| 7 | Spain | $1,902 | Approx. 294,800 yen | $4,580 | Approx. 710,000 yen | ▲58.5% |
| 8 | Argentina | $1,870 | Approx. 289,900 yen | $3,400 | Approx. 527,000 yen | ▲45.0% |
| 9 | Germany | $1,714 | Approx. 265,700 yen | $5,200 | Approx. 806,000 yen | ▲67.0% |
| 10 | Portugal | $1,687 | Approx. 261,500 yen | $4,290 | Approx. 665,000 yen | ▲60.7% |
| … | … | … | … | … | … | … |
| 32 | Japan | $900 | Approx. 139,500 yen | $1,015 | Approx. 157,000 yen | ▲11.3% |
| … | … | … | … | … | … | … |
| 40 | Saudi Arabia | $645 | Approx. 100,000 yen | $712 | Approx. 110,000 yen | ▲9.4% |
| 41 | Tunisia | $587 | Approx. 91,000 yen | $897 | Approx. 139,000 yen | ▲34.5% |
| 42 | Curacao | $568 | Approx. 88,000 yen | $820 | Approx. 127,000 yen | ▲30.7% |
Analysis 1: Characteristics of countries with persistently high prices
Among the countries ranked at the top, particularlyMexico and the other North American host nations,
a clearhost-country premiumexists.
Local demand is overwhelmingly strong
Lower-priced inventory rarely remains on the market
Due to this structural pattern, even after the initial price surge subsided, prices have remained relatively elevated.
Additionally, the reason South Korea and Colombia rank above European powerhouses is that
they were matched against opponents like Mexico, whose games attracted globally concentrated demand,and as a result,
their country-level averages were pushed upward.
Analysis 2: The initial hype that inflated right after the lottery
Comparing with the average prices just before the lottery,
for countries such as South Africa, Spain, Germany, and the Netherlands,
the expectation-driven prices were significantly corrected.This can be observed.
This is because
Opening matches
Matchups involving star players
These were obvious draws that attracted concentrated speculative pricing.
Analysis 3: Countries with stable prices = countries with strong genuine demand
On the other hand, for countries like Japan and Canada,
the price decline from pre-lottery levels has been small.
These countries share characteristics such as:
Demand is driven by actual fans rather than speculation
Extreme highs and lows in pricing are uncommon
Given these characteristics,price stability indicates strong underlying real demand.This is what the data suggests.
Scope of this article (important)
In this article, we examineThis analysis is limited to a country-level popularity and price trend analysis using official resale prices..
Therefore,
Specific seat locations (behind goal / sideline, etc.)
Highest and lowest prices for each match
Tendency of each category (Cat 1-4) to rise or fall
Price differences based on stadium structure and sightlines
Topics such as these,which are more practical and granular,are not covered here.
These will beanalyzed step by step in separate articles..
Summary
This analysis isbased on FIFA official resale prices.
Ticket prices serve as one indicator of popularity and demand.
The initial price surge has largely subsided, and differences in real demand by country are becoming visible.
Japan's prices are stable, suggesting it is a country driven primarily by real fan demand.

Comments