
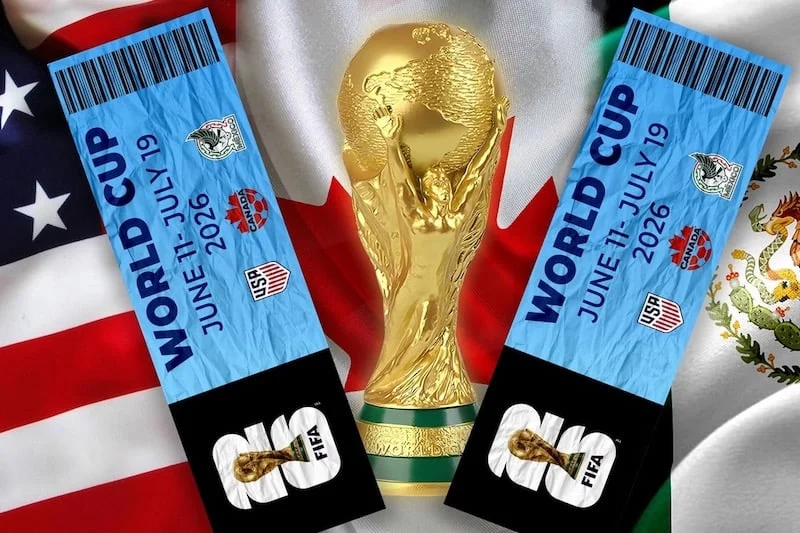
The Great 'Bubble Burst' Right After the Draw
-- Match-by-Match Price Trend Analysis (JPY Conversion)
In the previous article,we organized country-by-country popularity and price trends using FIFA official resale pricesin our previous article.
In this Part 2, we shift our perspective and analyzehow prices moved on a match-by-match basisin this article.
Right after the draw, market prices concentrated on obvious factors like
the opening match, host countries, and top-tier nations.
However, looking at the current official resale prices,
many of those prices have undergone significant corrections.many of those prices have undergone significant corrections.
In this article, we examine
- which matchups saw bubbles form,
- which matchups saw them burst,
- and which matchups were truly strong,
using official resale price data to organize our findings.
- About this article (assumptions)
- 1. [Platinum Cards] Overall Top 3 (including host countries)
- 2. [True Platinum] Top 3 excluding host countries
- 3. [Great Bubble Burst] What happened right after the draw
- 4. [Bargain Cards] Bottom 3 (lowest prices across all categories)
- Overall Summary (Official Resale Prices - Part 2)
About this article (assumptions)
- Reference data:FIFA official resale prices
- Listed prices:JPY conversion (1 USD = 155 JPY)
- Price definition:
For each match, we checked the lowest listed price across all categories (Cat1-4),
and adopted the 'effective entry price you cannot avoid to watch that match.'
* Individual seat positions, highest/lowest prices, and category-specific price trends are
To be analyzed in upcoming articles.
1. [Platinum Cards] Overall Top 3 (including host countries)
The host country premium strongly influences pricing,Matchups where affordable seat categories barely exist on the official resale market.
* Below, effective entry prices are the lowest price across all categories
| Rank | Match No. | Match | Effective Entry Price (JPY) | Situation Analysis |
|---|---|---|---|---|
| 1st | Match 1 | Mexico vs South Africa | 1,158,625 JPY | Opening match. Cat2 and below effectively sold out |
| 2nd | Match 53 | Euro PO D vs Mexico | 340,814 JPY | Even the cheapest Cat3 is about 340,000 JPY |
| 3rd | Match 3 | Canada vs Euro PO A | 285,200 JPY | Canada's first match. Cat3 remains firm |
Key Point
These are not speculative;local demand (real demand) completely dominates pricing for these matchups..
A typical example where the strategy of 'waiting for cheaper seats' simply does not work.
2. [True Platinum] Top 3 excluding host countries
Even without the host country factor,these matches maintain high price levels purely on the appeal of the matchup itself..
* Below, effective entry prices are the lowest price across all categories
| Rank | Match No. | Match | Effective Entry Price (JPY) | Situation Analysis |
|---|---|---|---|---|
| 1st | 85,250 yen | Colombia vs Portugal | 276,288 JPY | Even Cat4 is about 270,000 JPY |
| 2nd | 80,600 yen | Uruguay vs Spain | 231,725 JPY | Two World Cup winners face off. Cat3 at 230,000 JPY |
| 3rd | Match 48 | Colombia vs FIFA PO 1 | 196,075 JPY | South American matchups remain firm |
Key Point
Factors like top-tier teams, star player expectations, and neutral-site hosting combine to create
matchups that achieved 'platinum status' even without host country involvement..
3. [Great Bubble Burst] What happened right after the draw
Here, wedirectly compare official resale prices right after the draw with current prices,organizing which matchups saw 'initial bubbles' and how much they collapsed.
ComparisonRight After DrawCurrent PriceChange
| Rank | 1,627,800 JPY | 379,750 JPY | -1,248,050 JPY | 534,325 JPY | 231,725 JPY |
|---|---|---|---|---|---|
| 1st | 66 | Uruguay vs Spain | -302,600 JPY | 405,225 JPY | 196,075 JPY |
| 2nd | 21 | Ghana vs Panama | -209,150 JPY | 128,185 JPY | -95,480 JPY |
| 3rd | 23 | Portugal vs FIFA PO 1 | 257,300 JPY | 174,685 JPY | -82,615 JPY |
| (Reference) | 11 | Netherlands vs Japan | 204,910 JPY | 178,095 JPY | -26,815 JPY |
| (Reference) | 36 | Tunisia vs Japan | 124,775 JPY | 115,940 JPY | -8,835 JPY |
The largest decline was Uruguay vs Spain, with Cat1 alone falling about 1.25 million JPY, clearly identifying the matchup where the post-draw hype bubble was biggest.
On the other hand,the two Japan matches saw declines of only tens of thousands of JPY,showing that even Cat1 prices were formed on real demand from the start.
Cat1 is not 'the strongest seat category';for high-profile matchups, it is the category most susceptible to inflation and most likely to deflate.(However, some matchups like Mexico tend to sustain elevated values temporarily.)
4. [Bargain Cards] Bottom 3 (lowest prices across all categories)
Currently,matchups where you can attend the World Cup live starting from the 20,000-30,000 JPY range.
| Rank | Match No. | Match | Lowest Category Price (JPY) | Situation Analysis |
|---|---|---|---|---|
| 1st | Match 65 | Cape Verde vs Saudi Arabia | 25,846 JPY | One of the best hidden gems of this tournament |
| 2nd | Match 72 | FIFA PO 1 vs Uzbekistan | 28,520 JPY | Cat3 below 30,000 JPY |
| 3rd | Match 55 | Curacao vs Ivory Coast | 33,868 JPY | World Cup experience for 30,000 JPY range |
Overall Summary (Official Resale Prices - Part 2)
- These are matchups where the market has fully cooled, and you can attend the World Cup at 'off-season prices.'Rather than being unpopular, they are better described as matchups where the initial speculation has completely drained away.
- Host country matchups and strong matchups retainresidual value even after the bubble.
- Due to bubble deflation,realistic opportunities to watch top-tier teams for 45,000-80,000 JPYhave emerged.
- The market is no longer driven by 'expectations' but has shifted toa real-demand-based valuation phase..
Next Preview (Official Resale Prices - Part 3)
In the next article, based on official resale price data,
we will analyze from the perspective of 'Which categories (Cat1-4) held their value even after the bubble burst?'
.
- Which category saw the biggest decline in the initial bubble?
- Which seats served as the 'real demand safety net' that held prices until the end?
- What was different between top-tier matchups and less popular matchups?
We will organize these findings and visualize 'which seats were ultimately the strongest.'

Comments